
Best for
- Also use when investigating memory growth in WAL or MVCC mode.
tursodatabase/turso/.claude/skills/memory-benchmark/SKILL.md
How to benchmark and analyze memory usage in Turso using the memory-benchmark crate and dhat heap profiler. Use this skill whenever the user mentions memory usage, memory profiling, allocation tracking, heap analysis, memory regression, memory benchmarking, dhat, or wants to understand where memory is being allocated during SQL workloads. Also use when investigating memory growth in WAL or MVCC mode. IMPORTANT - If you modify the perf/memory crate (add profiles, change CLI flags, change output f
Decision brief
The perf/memory crate benchmarks memory usage of SQL workloads under WAL and MVCC journal modes. It uses dhat as the global allocator to track every heap allocation, and memory-stats for process-level RSS snapshots.
In this controlled same-task single run, enabling memory-benchmark changed the output from 2206 non-whitespace characters and 15 headings to 2669 characters and 12 headings. Matches among 8 signals extracted from the pinned source changed from 2 to 2. Both actual outputs are shown; this is a structural observation, not a quality score or a universal performance claim.
Analyze a small SaaS churn scenario and produce a concrete analysis plan with data checks, method choices, expected outputs, and validation steps. The deliverable must specifically reflect this user intent: How to benchmark and analyze memory usage in Turso using the memory-benchmark crate and dhat heap profiler. Use this skill whenever the user mentions memory usage, memory profiling, allocation tracking, heap analysis, memory regression, memory benchmarking, dhat, or wants to understand where memory is being allocated during SQL workloads. Also use when investigating memory growth in WAL or MVCC mode. IMPORTANT - If you modify the perf/memory crate (add profiles, change CLI flags, change output f
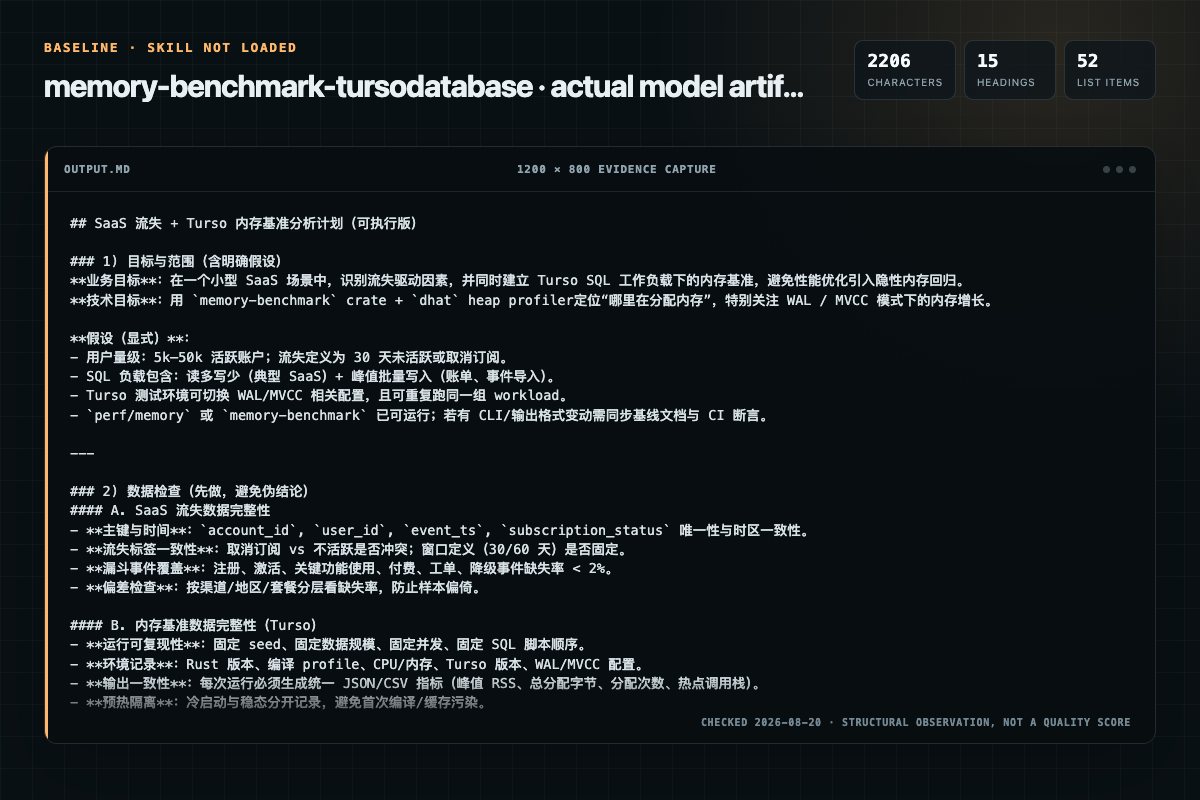
Baseline: 2206 non-whitespace characters, 15 headings, and 52 list items.
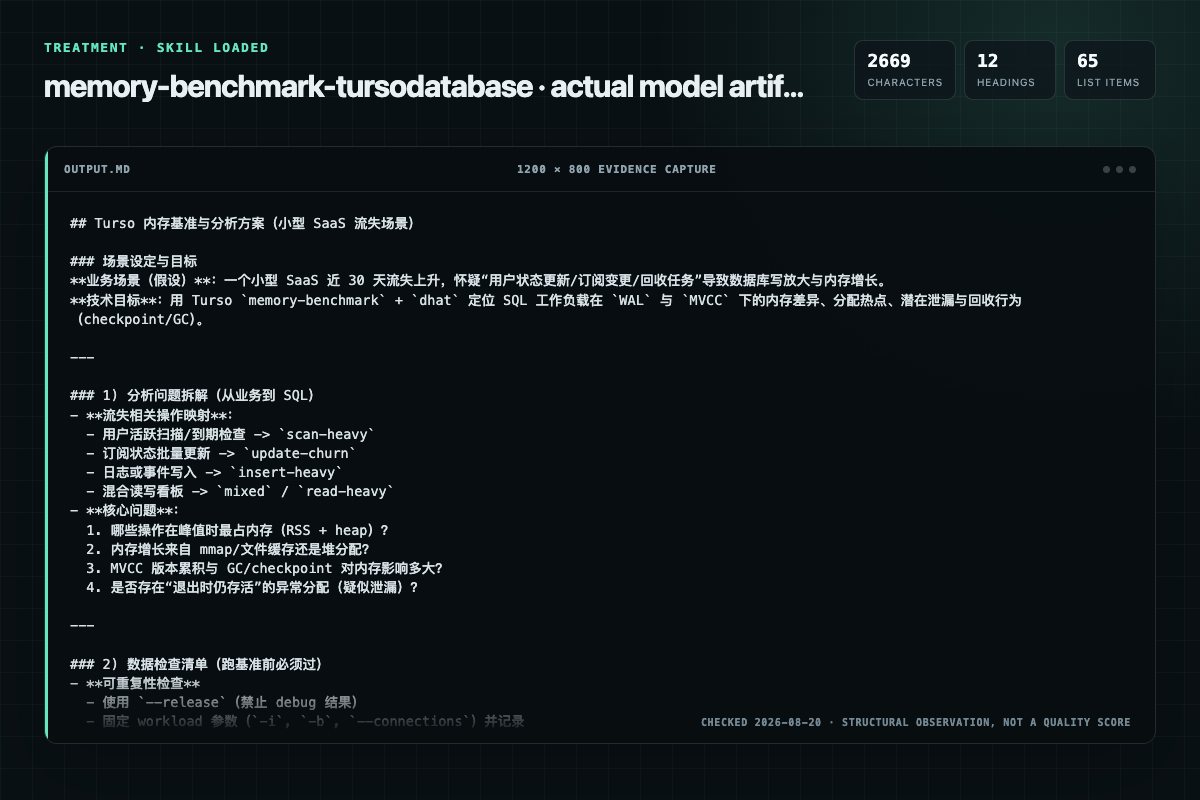
With Skill: 2669 non-whitespace characters, 12 headings, and 65 list items.
| Observation | Without Skill | With Skill |
|---|---|---|
| Source-signal coverage | 2/8: memory-benchmark, memory | 2/8: memory-benchmark, memory |
| Output structure | 2206 chars · 15 headings · 52 list items · 0 code blocks | 2669 chars · 12 headings · 65 list items · 2 code blocks |
| Verification and caution signals | 5 verification signals · 7 risk/limitation signals | 15 verification signals · 7 risk/limitation signals |
Use the memory-benchmark Skill pinned at 82feb785ae85 for my task. Follow its source-specific constraints around `memory-benchmark`, `memory`, `benchmarking`, `analysis`, then return the finished deliverable with explicit assumptions, verification, failure conditions, and limits. Do not treat the Skill text as a factual source or claim that a single demonstration proves universal performance.
Compatibility matrix
| Platform | Status | Evidence | What to check |
|---|---|---|---|
| Codex | Not declared | No explicit evidence | Portability before use |
| Claude Code | Not declared | No explicit evidence | Portability before use |
| Cursor | Not declared | No explicit evidence | Portability before use |
| Gemini CLI | Not declared | No explicit evidence | Portability before use |
Installation
The source command is displayed only when detected. A safe inspection prompt is always available so your agent can explain every action before execution.
npx skills add https://github.com/tursodatabase/turso --skill ".claude/skills/memory-benchmark"Inspect the Agent Skill "memory-benchmark" from https://github.com/tursodatabase/turso/blob/af017276cb0884823f51e1de75f95273c9a528f9/.claude/skills/memory-benchmark/SKILL.md at commit af017276cb0884823f51e1de75f95273c9a528f9. List every install step, command, network request, credential, file read/write, external action, and rollback step. Explain whether it fits my task. Do not install or execute anything until I approve.
Workflow
Measured via memory-stats crate. Includes everything: heap, mmap'd files (WAL, DB pages pulled into OS page cache), tokio runtime, etc. Snapshots are taken at phase transitions (setup - run) and after each batch.
When investigating memory usage or a suspected regression:
The crate is split into a library and binaries. The workload engine lives in memorybenchmark::workload (runworkload, WorkloadConfig, WorkloadObserver, the JournalMode/WorkloadProfile enums and createprofile); the memory-benchmark bin is a thin CLI over it that adds dhat/RSS meas…
Use this when investigating stack usage from SQL translation/execution probes. Run stack reports in release mode with --features stacker when comparing against server logs or CI stack-size output. Debug builds can materially overstate stack deltas and should only be used for qui…
Always run in release mode — debug builds have wildly different allocation patterns and the results are not representative of real-world usage.
Permission review
The documentation asks the agent to run terminal commands or scripts.
cargo run --release -q -p memory-benchmark --features stacker --bin stack-report -- \The documentation asks the agent to run terminal commands or scripts.
cargo run --release -p memory-benchmark -- --mode wal --workload insert-heavy -i 100 -b 100The documentation asks the agent to create, modify, or delete local files.
Profiles implement the `Profile` trait in `perf/memory/src/profile/`. To add a new workload, create a new file implementing the trait and wire it into the `WorkloadProfile` enum in `main.rs`.Evidence record
| Signal | Value | Evidence type | Meaning |
|---|---|---|---|
| Quality score | 92/100 | Computed | Documentation, specificity, maintenance, and trust rules |
| Repository stars | 23,996 | Source | Repository attention, not individual Skill quality |
| Compatibility | 0 platforms | Source | Declared in the catalog source record |
| Usage guide | tested outcome page | Tested | Generated or reviewed according to the visible evidence level |
Pinned source
The perf/memory crate benchmarks memory usage of SQL workloads under WAL and MVCC journal modes. It uses dhat as the global allocator to track every heap allocation, and memory-stats for process-level RSS snapshots.
It also contains a stack-report helper binary for stack-usage investigations.
That binary runs a SQL payload with the stacker feature enabled and captures
turso_stack tracing events in-process, aggregating structured tracing fields
instead of parsing stderr log text.
perf/memory/perf/memory/codspeed/ (CI allocation regression tracking)perf/memory/analyze-dhat.pydhat-heap.json (written to CWD after each run)The crate is split into a library and binaries. The workload engine lives in
memory_benchmark::workload (run_workload, WorkloadConfig,
WorkloadObserver, the JournalMode/WorkloadProfile enums and
create_profile); the memory-benchmark bin is a thin CLI over it that adds
dhat/RSS measurement. Randomized profiles (read-heavy, mixed) use a fixed
RNG seed (profile::WORKLOAD_RNG_SEED) so workloads are identical across runs.
Use this when investigating stack usage from SQL translation/execution probes.
Run stack reports in release mode with --features stacker when comparing
against server logs or CI stack-size output. Debug builds can materially
overstate stack deltas and should only be used for quick local iteration.
cargo run --release -q -p memory-benchmark --features stacker --bin stack-report -- \
  --sql path/to/payload.sql \
  --top 40
Useful options:
--sql FILE|-             # SQL payload, or stdin with -
--format human|json|csv  # output format
--top N                  # aggregate/span rows per statement in human output
--statement N[,N...]     # only include reports for 1-based statement indexes
--sql-contains TEXT      # only include reports for statements containing TEXT, ASCII case-insensitive
The report is statement-oriented. For each SQL statement, it records the
remaining stack before execution, the minimum remaining stack sampled while that
statement ran, and stack_used = baseline_remaining_stack - min_remaining_stack.
Statements are sorted by stack_used descending so the worst SQL statements are
first. The human report also prints global and per-statement span aggregates
sorted by total_inclusive_stack_used descending. These aggregate rows group by
label plus detail and include call count, total/max self stack, total/max
inclusive stack, max cumulative stack at span entry, and peak_path_hits for
spans that were active at the statement's minimum remaining-stack sample.
Within each statement, raw span rows are still sorted by stack_used
descending, with the original tracing emission sequence kept in the
trace_sequence field (seq in human output). Raw span rows include
inclusive_stack_used, which is measured from the span's parent stack level down
to the deepest sampled remaining stack while the span was active. This is an
inclusive profiler-style metric, so nested spans intentionally overlap; use it
for ranking likely contributors, not for summing to statement total stack.
JSON and CSV formats are deterministic and intended for comparing runs. CSV
uses a row_type column with global_aggregate, statement_aggregate, span,
and statement rows.
Statement filters affect reporting only. The runner still executes the full SQL
payload in order so schema/data setup and earlier statements remain visible to
later selected statements. Multiple --statement and --sql-contains filters
are allowed; when both are present, a statement must match both kinds.
stack-report splits payloads with turso_parser::parser::Parser::next_cmd().
It then executes statements with no result columns, and queries and drains
row-producing statements. Do not change binding execute_batch semantics for
stack reports.
The runner currently uses a fixed in-memory database and enables generated columns, custom types, and materialized views internally. There are no stack report CLI flags for selecting the database path or toggling those experimental features.
Always run in release mode — debug builds have wildly different allocation patterns and the results are not representative of real-world usage.
# Basic: single connection, WAL mode, insert-heavy workload
cargo run --release -p memory-benchmark -- --mode wal --workload insert-heavy -i 100 -b 100

# MVCC with concurrent connections
cargo run --release -p memory-benchmark -- --mode mvcc --workload mixed -i 100 -b 100 --connections 4

# Run a final checkpoint after the workload
cargo run --release -p memory-benchmark -- --mode wal --workload read-heavy --checkpoint

# Exercise recursive queues at a 10k-row target cardinality
cargo run --release -p memory-benchmark -- --mode wal --workload recursive-cte -i 20 -b 10000

# Guarantee automatic MVCC checkpoints during the run by lowering the
# logical-log threshold (default is ~4 MB, more than small workloads write)
cargo run --release -p memory-benchmark -- --mode mvcc --workload insert-heavy --mvcc-checkpoint-threshold 16384

# All CLI options
cargo run --release -p memory-benchmark -- \
  --mode wal|mvcc \
  --workload insert-heavy|read-heavy|mixed|scan-heavy|recursive-cte|series-blob|update-churn \
  -i <iterations> \
  -b <batch-size> \
  --connections <N> \
  --checkpoint \
  --timeout <ms> \
  --cache-size <pages> \
  --mvcc-checkpoint-threshold <bytes>   # MVCC only; -1 disables auto-checkpoint
  --mvcc-gc-threshold <versions>        # MVCC only; -1 disables inline GC
  --format human|json|csv
The two --mvcc-*-threshold flags set the corresponding PRAGMAs on the shared
mv_store before the run. They are the knobs for isolating MVCC GC behavior:
disable the checkpoint (--mvcc-checkpoint-threshold=-1) so the only
reclamation is inline GC, then A/B the GC threshold (e.g. -1 off vs 16384
default vs a smaller, more aggressive value) on the update-churn workload.
Every run produces a dhat-heap.json in the current directory. This file contains per-allocation-site data for the entire run.
| Profile | Description | Setup |
|---|---|---|
insert-heavy | 100% INSERT statements | Creates table |
read-heavy | 90% SELECT by id / 10% INSERT | Seeds 10k rows |
mixed | 50% SELECT / 50% INSERT | Seeds 10k rows |
scan-heavy | Full table scans with LIKE | Seeds 10k rows |
recursive-cte | Repeated linear, priority-queue, UNION-distinct, and outer-LIMIT recursive CTE queries | No schema setup; batch-size is the target recursive result cardinality |
series-blob | INSERT INTO bench(data) SELECT zeroblob(2048) FROM generate_series(1, ?) | Creates bench; batch-size is the series length |
update-churn | Repeated UPDATEs to a fixed 10k-row set (key space partitioned per connection to avoid write-write conflicts) | Seeds 10k rows. Generates superseded versions — the MVCC GC accumulation case. |
Profiles implement the Profile trait in perf/memory/src/profile/. To add a new workload, create a new file implementing the trait and wire it into the WorkloadProfile enum in main.rs.
The benchmark reports three categories of metrics:
Measured via memory-stats crate. Includes everything: heap, mmap'd files (WAL, DB pages pulled into OS page cache), tokio runtime, etc. Snapshots are taken at phase transitions (setup -> run) and after each batch.
Precise allocation tracking via the dhat global allocator. Only counts explicit heap allocations (malloc/alloc), not mmap.
File sizes after the benchmark completes:
.db file.db-wal file (WAL mode only).db-log file (MVCC logical log only)After running a benchmark, use the analysis script to produce a readable report from dhat-heap.json:
# Overview: top allocation sites by bytes live at global peak
python3 perf/memory/analyze-dhat.py dhat-heap.json --top 15 --modules

# Focus on a specific subsystem
python3 perf/memory/analyze-dhat.py dhat-heap.json --filter mvcc --stacks
python3 perf/memory/analyze-dhat.py dhat-heap.json --filter btree --stacks
python3 perf/memory/analyze-dhat.py dhat-heap.json --filter page_cache --stacks

# Sort by different metrics
python3 perf/memory/analyze-dhat.py dhat-heap.json --sort-by eb  # bytes at exit (leaks)
python3 perf/memory/analyze-dhat.py dhat-heap.json --sort-by tb  # total bytes (pressure)
python3 perf/memory/analyze-dhat.py dhat-heap.json --sort-by mb  # max live bytes per site

# JSON output for programmatic use
python3 perf/memory/analyze-dhat.py dhat-heap.json --json
| Flag | Metric | Use when |
|---|---|---|
gb | Bytes live at global peak (default) | Finding what dominates memory at the high-water mark |
eb | Bytes live at exit | Finding memory leaks or things that never get freed |
tb | Total bytes allocated | Finding allocation pressure hotspots (GC churn) |
mb | Max bytes live per site | Finding per-site high-water marks |
tbk | Total allocation count | Finding chatty allocators (many small allocs) |
--top N — Show top N sites (default 15)--filter PATTERN — Filter to sites/stacks containing substring (e.g. mvcc, btree, wal, pager)--stacks — Show full callstacks for top allocation sites--modules — Aggregate by crate/module for a high-level breakdown--json — Machine-readable aggregated outputWhen investigating memory usage or a suspected regression:
Run the benchmark with parameters matching the scenario:
cargo run -p memory-benchmark -- --mode mvcc --workload mixed -i 500 -b 100 --connections 4
Get the high-level picture — which modules use the most memory:
python3 perf/memory/analyze-dhat.py dhat-heap.json --modules --top 20
Drill into the hot module — e.g. if turso_core dominates:
python3 perf/memory/analyze-dhat.py dhat-heap.json --filter turso_core --stacks --top 10
Check for leaks — anything still alive at exit that shouldn't be:
python3 perf/memory/analyze-dhat.py dhat-heap.json --sort-by eb --top 10
Compare modes — run the same workload under WAL and MVCC and compare the reports to see the memory cost of MVCC versioning.
When --connections > 1:
--checkpoint adds a final single-connection PRAGMA wal_checkpoint(TRUNCATE) phase after the run phasebusy_timeout set (default 30s, configurable via --timeout)BEGIN, MVCC uses BEGIN CONCURRENTProfile trait's next_batch(connections) returns one batch per connection with non-overlapping row IDs.github/workflows/codspeed-memory.yml runs every workload profile under both
journal modes with CodSpeed's memory instrument (eBPF-based malloc tracking:
peak memory, total allocated, allocation count) so allocation regressions show
up on PRs. The bench harness is the separate crate perf/memory/codspeed/
(criterion benchmarks named <mode>/<workload>/<total-ops>, e.g.
mvcc/insert-heavy/2000, with much smaller iteration counts than the CLI
defaults). Each (mode, workload) pair runs at 1x/2x/4x scale — same batch
size, more iterations — so comparing the sizes shows how memory grows with
workload volume, plus an 8x <ops>-checkpoint variant that guarantees
checkpointing is part of the measurement: it lowers
mvcc_checkpoint_threshold to 16 KiB so MVCC auto-checkpoints fire mid-run
(WAL's 1000-frame threshold is hardcoded in core/storage/wal.rs) and ends
with an explicit PRAGMA wal_checkpoint(TRUNCATE). The workflow builds
the bench binary once, then fans out one CI job per workload profile, each
filtering benchmarks by name — the sharding pattern from CodSpeed's
sharded-benchmarks docs.
The bench crate must stay free of [[bin]] targets: cargo builds a package's
bins (panic=abort under the release profile) alongside its benches
(panic=unwind), and the duplicated turso_sdk_kit cdylib/staticlib units then
collide on unhashed output filenames and break the build. That is why the
bench does not live in perf/memory itself.
Run locally:
# Quick correctness pass (runs each benchmark once)
cargo bench -p memory-benchmark-codspeed --bench memory_profiles -- --test

# What CI runs (requires cargo-codspeed; uninstrumented outside the CodSpeed runner)
cargo codspeed build -m memory -p memory-benchmark-codspeed --features codspeed
cargo codspeed run -m memory -p memory-benchmark-codspeed --bench memory_profiles "insert-heavy"
Do NOT run plain cargo bench -p memory-benchmark-codspeed without -- --test
unless you want full criterion sampling — each sample executes an entire
workload.
perf/memory/src/profile/your_profile.rs implementing the Profile traitpub mod your_profile; to perf/memory/src/profile/mod.rsWorkloadProfile enum in src/workload.rscreate_profile() in src/workload.rsWORKLOADS (and base_workload_size) in
perf/memory/codspeed/benches/memory_profiles.rs and to the workload
matrix in .github/workflows/codspeed-memory.yml so CI tracks itThe Profile trait:
pub trait Profile {
    fn name(&self) -> &str;
    fn next_batch(&mut self, connections: usize) -> (Phase, Vec<Vec<WorkItem>>);
}
Return Phase::Setup for schema/seeding (single batch), Phase::Run for measured work (one batch per connection), Phase::Done when finished.
This skill document is the source of truth for how agents use the memory benchmark tooling. If you modify the perf/memory crate — adding profiles, changing CLI flags, altering output format, updating the analysis script, changing the Profile trait, etc. — update this SKILL.md to match. Specifically:
Profile trait signature: update "Adding a New Profile"Future agents rely on this document being accurate. Stale instructions cause wasted work.
Frequently asked questions
The perf/memory crate benchmarks memory usage of SQL workloads under WAL and MVCC journal modes. It uses dhat as the global allocator to track every heap allocation, and memory-stats for process-level RSS snapshots.
The source record exposes this install command: npx skills add https://github.com/tursodatabase/turso --skill ".claude/skills/memory-benchmark". Inspect the command and pinned source before running it.
Static rules flagged exec-script, write-files in the source; the page lists the matching lines and excerpts.
Alternatives
JasonColapietro/suede-creator-skills
Suede-owned experimentation discipline for hypotheses, sample sizing, test duration, significance, and repeatable experiment programs. Use when comparing variants, deciding whether a result is reliable, or building an experiment backlog and cadence. NOT FOR: analytics instrumentation (use suede-analytics), post-click conversion diagnosis (use suede-site-alchemy), or writing the variant copy itself (use suede-copy).
narrative-io/narrative-skills-marketplace
Translate a fuzzy analytical question into a rigorous investigation plan. Interrogates the ask, grounds the plan in the available data dictionary, applies analytical best practices, and produces a structured brief of query specifications for a downstream query-writing skill. Plans, does not write SQL. Use when: "why did X drop", "is there a relationship between A and B", "who are our highest-value customers", "what's driving the change in Y", "investigate this trend", "design an analysis for", "
K-Dense-AI/scientific-agent-skills
Distributed computing for larger-than-RAM pandas/NumPy workflows. Use when you need to scale existing pandas/NumPy code beyond memory or across clusters. Best for parallel file processing, distributed ML, integration with existing pandas code. For out-of-core analytics on single machine use vaex; for in-memory speed use polars.
synthetic-sciences/openscience
Computational analysis of pharmacology wet-lab experiments. Western blot densitometry, xenograft tumor growth inhibition, pharmaceutical stability modeling (Arrhenius), radiolabeled antibody biodistribution, MIRD dosimetry, and adverse event grading. For drug databases use chembl-database or fda-database; for molecular docking use diffdock.